[USDJPY thorough analysis] Win with MT4! How to read recent price movements using center lines and channel lines
Trading
There's a quick video and a pictorial analysis followed by a deep dive article.
Earn 10 pips in FX trading.
The analysis video is here.
This video explains it.
First of all, it is common to draw a line from the higher time frame, but in fact this can be off when using MT4.
The reasons for this are explained in this article, so please give it a try.
Solving various problems! Detailed information on MT4
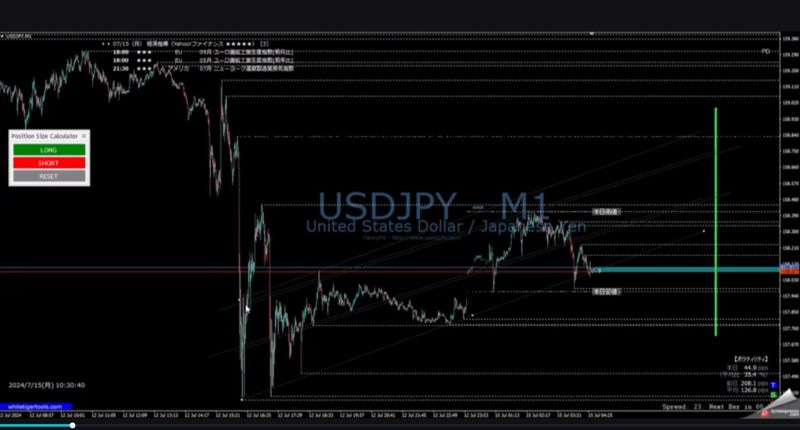
So, this time we will draw lines from short-term charts.
First, let's start with the channel line.
Previously, the 1 minute and 5 minute lines were displayed in red, but since this did not allow for very effective lines to be drawn, the lines were made thinner, reducing the clutter and recognizability of the chart, so that other lines would unconsciously take priority.
This means that you will focus on lines of 15-minute or longer charts, naturally avoiding poorly-founded trades on shorter-term charts.
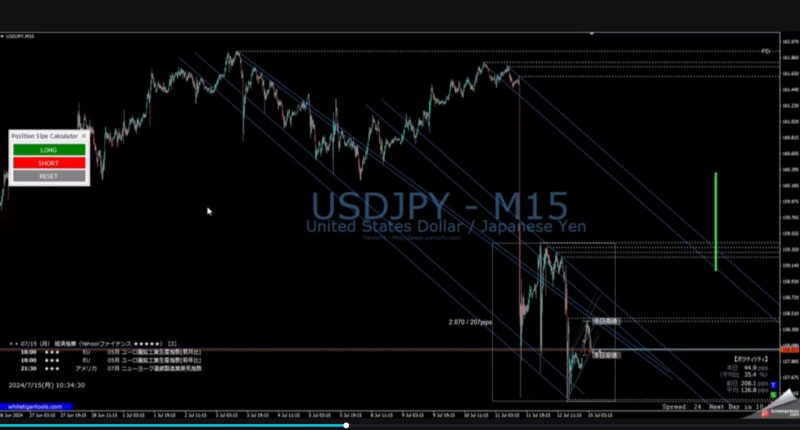
In the same way, draw channel lines for the higher time frames.
At this time, it is important to be aware of past price movements, but the most recent movements are given priority.
Therefore, if there is a slight deviation, it tends to be easier to hear if you adjust it to the most recent resistance rather than adjusting it from the past.
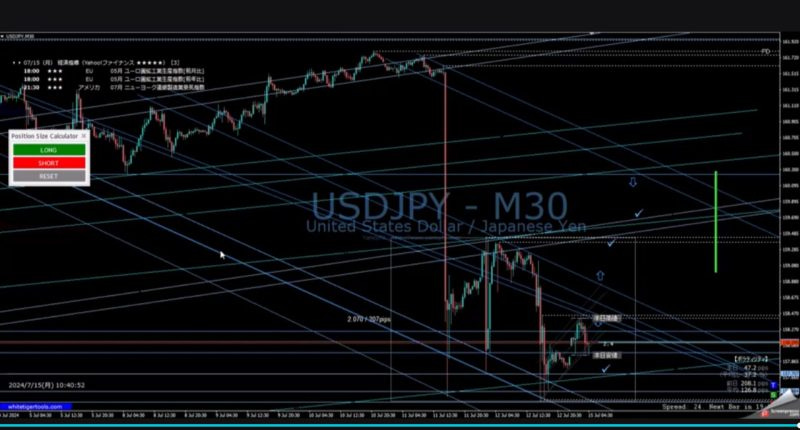
We will make fine adjustments.
Of course, you also need to pull back the leg above, but we drew a square resistor earlier, and this is like a hierarchy, and by passing through this part you move on to the next hierarchy.
For other resistors, you will need to draw a resistance line, but honestly, it doesn't matter which one you use as long as you can see that there is resistance. Make sure you draw it in a way that is easy for you to see.
Finally, decide where you want to enter and take profits and your analysis is complete.
Table of Contents
2. Channel Line: A new strategy starting from short-term charts
3. Higher time frame channel line: balance between past and present
[USDJPY thorough analysis] Win with MT4! How to read recent price movements using center lines and channel lines
This time, I will tell you the secrets of USDJPY (US Dollar / Yen) analysis using MT4. If you know the tricks to effectively draw channel lines and resistance lines, your trading may change dramatically. Come on, let's learn together!
1. Are there actually any pitfalls in MT4 chart analysis?
MT4 users, don't you think it's common sense to draw a line from the higher time frame? In fact, this can sometimes cause discrepancies.
Why does the discrepancy occur?
Differences in data aggregation methods
Differences in data collection methods depending on time period
When to sync with the server
These factors can result in slight price differences between higher and lower time frames even during the same time period.
2. Channel Line: A new strategy starting from short-term charts
Conventional method: Display 1 minute and 5 minute in red
Advantages of this method:
Reduce chart clutter
Your eyes will naturally be drawn to lines longer than 15 minutes.
Avoid short-term trades that are based on weak evidence
Specific steps:
Open 1 minute and 5 minute charts
Set the line color to a light gray
When drawing a channel line, connect the major highs and lows.
Adjust the line thickness to be thinner
This method makes it easier to see larger trends without getting lost in short-term noise.
3. Higher time frame channel line: balance between past and present
Drawing channel lines on higher time frames is very important for getting a good overview of the trend. The key here is to focus on recent movements while also taking into account past data.
point:
Past price movements are for reference only
Prioritize the latest developments
Fine adjustments for improved accuracy
Of course, it is common to subtract from the higher time frame and it does not differ from TradingView, so there is no problem at all.
First, draw rough channel lines on weekly and daily charts to grasp the long-term trend.
Next, draw a line connecting the most recent high and low prices on the 4-hour and 1-hour charts.
If there is a discrepancy between the past line and the most recent line, the most recent line takes precedence.
If necessary, tweak the historical line to match the most recent movement.
This approach allows you to draw a channel line that more accurately reflects current market conditions.
4. Resistance line vs. resistor: tips on how to use them
In chart analysis, it is important to know how to use resistance lines and resistance bodies (squares). Understanding the characteristics of each and using them appropriately will enable more accurate analysis.
Resistor (square): Used to create the image of stairs
Resistance is good for showing areas where price will remain for a certain period of time. It is easier to understand it if you think of it as a staircase.
Draw boxes around major past highs and lows
If the price reaches this area, keep an eye out for a breakout or bounce
If a breakout occurs, predict a move to the next resistance
Resistance line: Draw freely with emphasis on visibility
Resistance lines are straight lines drawn along the price movement that can help you gauge trend direction and momentum.
Connecting major highs or lows
The lines do not need to be precise, it is important to capture the overall trend.
Draw resistance lines on multiple time scales to check consistency
Key takeaway:
5. Entry and profit taking: Building a strategy using lines
By effectively using channel lines and resistance lines, you can set more accurate entry and profit taking points.
How to identify the entry point
Entry near the bottom of the channel:
If the price touches the lower limit of the channel during an uptrend, it is a good opportunity to enter a buy position.
If the upper limit of the channel is touched during a downtrend, it is a good opportunity to enter a sell position.
Resistance breakout:
If the price breaks through a key resistance level, consider entering in the direction of the breakout.
Check multiple time scales:
Entries where the short-term and long-term lines meet are more reliable
Setting appropriate profit points
The other side of the channel line:
For long positions, the upper limit of the channel is the target for taking profits.
For short positions, the target for taking profits is the lower limit of the channel.
Next major resistance level:
Set important past highs and lows or round numbers as profit-taking points
Consider the risk/reward ratio:
Ensure that the distance between your entry and profit points is appropriate for your risk-reward ratio (e.g. 1:2 or greater)
Practical techniques:
Before entering, use the channel and resistance lines to calculate the expected profit margin.
Check the consistency of lines across multiple time scales to select more reliable points
Flexible profit-taking points depending on market volatility
6. Smart stop loss: Use the line to your advantage
A proper stop-loss strategy is crucial to ensure long-term profits. Using channels and resistance levels can help you make more objective and effective stop-loss decisions.
Two stop loss approaches:
Judging based on the drawn line
If the price breaks out of the channel line:
For example, if the price breaks below the lower limit of the channel during an uptrend, consider cutting your losses as the trend may be reversing.If the price fails to break through a critical resistance line:
If the price moves in the opposite direction to what you expected, immediately cut your losses.
If you sense danger, make an immediate, intuitive decision
When the market suddenly changes or unexpected news comes out:
When the chart movement is different from usual, intuitive judgment is also important.Volatility surge:
If you see a sudden price movement, consider exiting the market without waiting for the stop loss line you set.
Points to remember when implementing stop loss strategies:
Set a stop loss line in advance: Always decide on a stop loss line when entering
Risk Management: Limit risk per trade to 1-2% of your capital
Multi-time frame check: distinguish short-term noise from real trend reversals
Analysis after stop loss: Calmly analyze why the stop loss occurred and use that knowledge in your next trade
Important:
Summary: Three key points for winning in USDJPY analysis
Understand the characteristics of MT4 and draw lines from short-term charts
Avoid deviations caused by drawing lines from higher time frames
Understand long-term trends while utilizing short-term information
Effective combination of channels and resistance lines
Capture the overall trend with channel lines
Resistance lines identify important price levels
Using lines to determine entry, profit taking, and stop loss
Selection of entry points based on lines
Setting appropriate profit targets
Objective loss-cutting decisions
If you master these techniques, your USDJPY analysis will definitely improve dramatically! Please try them out and improve the accuracy of your trading.


